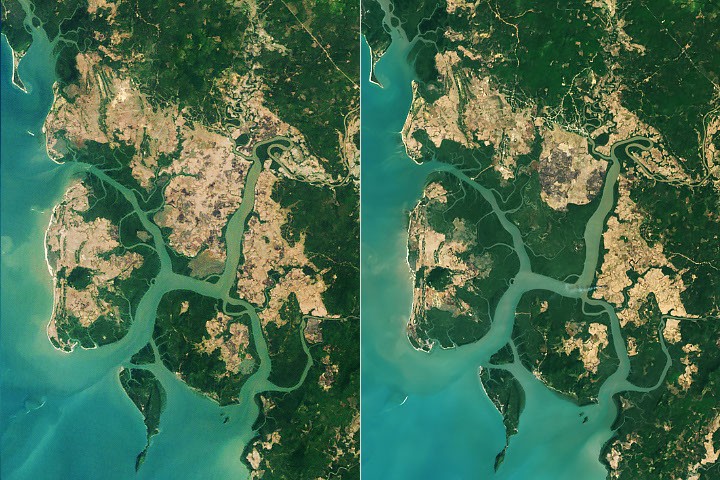
Imagine you've been tracking a patient's weight loss for 25 years, watching the numbers drop steadily on the scale. Then one day around year 26, the line bends upward. You'd want to know: is this a real recovery, or a blip? And crucially — is the patient healthy everywhere, or just gaining weight in some limbs while others atrophy? That's what Zhang et al. just answered for the world's mangrove forests. The committed claim: global mangrove extent reversed a multi-decade decline around 2010, gaining nearly 2,000 square kilometers between 2010 and 2023 after losing nearly 3,000 square kilometers between 1984 and 2010. This is the first study to map the shift at global scale over a 39-year Landsat record. The finding isn't just about area — canopy density has increased too, particularly in South America, indicating healthier forests, not just wider ones. The architecture is straightforward remote sensing: Landsat 5 TM and Landsat 9 OLI imagery analyzed for mangrove extent and canopy density changes from 1984 to 2023. The method leans on the extraordinary continuity of the Landsat program — nearly four decades of consistent, medium-resolution optical data with global coverage. No machine learning exotica here; this is careful change detection over the longest continuous satellite record available for land cover. The ladder matters. Previous studies mapped mangrove change regionally or over shorter time windows. Zhang's team at Tulane is explicit that these are the first global mangrove maps covering such a long period. The baseline they're beating isn't a competing algorithm — it's the completeness of prior geographic and temporal coverage. Two-thirds of the expansion came from mangroves colonizing new areas (sediment deposition creating mudflats, warming temperatures allowing poleward migration), while one-third came from restoration and regrowth in degraded areas. The geographic unevenness is the integrity check readers should focus on. Asia, Australia, and South America drove the rebound. Burma alone lost 28.6 percent of its mangrove area between the 1980s and 2010, then grew back about 10 percent — a meaningful but partial recovery attributed to post-tsunami awareness, legal protections, and new sedimentation. Meanwhile, the Niger Delta is still losing. North America and southern Africa have seen cyclone-driven degradation. The global net gain is real but masks regional collapses. The ecological stakes are outsized relative to the trees' physical stature. Mangroves average about 13 meters tall but store up to four times as much carbon per unit area as taller inland tropical forests. They protect coastlines from erosion and storm surges and serve as nursery habitat for marine species. The carbon math alone makes their trajectory a first-order climate variable. Zhang himself cautions against complacency: the global rebound should not obscure ongoing losses in West and Central Africa or cyclone vulnerabilities elsewhere. The next milestone isn't a number — it's whether the net-positive trend survives the next decade of intensifying tropical cyclones and coastal development pressure. The obvious next study the authors didn't run: projecting mangrove trajectory under different warming and sea-level scenarios. Likely saving it for the follow-up, since the 39-year observational record is the foundation that makes projection credible.
The analogy
Imagine tracking a patient's weight for 25 years on the same bathroom scale, watching the number drop every visit. Then around year 26, the line bends upward. You'd want to know: is this real recovery or a blip? And is the patient gaining weight everywhere, or just in some limbs while others atrophy? Zhang et al. used the world's most consistent 'bathroom scale' — Landsat — and found the patient is genuinely recovering, but unevenly.
Patient weigh-in
Same scale, same protocol, decades of visits — weight loss reverses to weight gain, but you check each limb separately
Landsat mangroves
Same sensor family, same resolution, 39 years of imagery — area loss reverses to area gain, but you check each region separately
Honest assessment
This is a strong observational result, not a methods breakthrough. The 39-year Landsat record gives it temporal authority no other study has matched at global scale. The main vulnerability is classification accuracy in messy coastal pixels and the absence of climate-scenario projections. Conservation scientists and coastal policymakers should take this seriously today; the carbon-budget implications alone make it first-order. Engineers and ML researchers won't find novel methods here, but the dataset is a foundation others will build on.
What Is CLAIMS?
70
/ 100
BedrockNews applies a structured analytical framework called CLAIMS to academic papers and technical research releases.
How CLAIMS worksClaim
4/5
Ladder
3/5
Architecture
3/5
Integrity
4/5
Milestone
3/5
Successor
4/5
What is this paper actually committing to?
Genuine first at global scale: 39-year Landsat record showing mangrove decline reversed ~2010. The claim is about coverage completeness, not algorithmic novelty — but the result is new and significant.
The field fight
Are global ecosystem declines reversible at scale, or is loss essentially permanent without massive intervention?
Side A
Ecosystem loss is a ratchet — once degraded, recovery is marginal without heroic restoration
Held by: IPBES, most conservation biology
Side B
Given reduced pressure and natural processes, ecosystems can self-recover at meaningful scale
Held by: Rewilding advocates, this paper
Milestone tracker
Unlocks: Net-positive global mangrove carbon budget relative to pre-satellite era
Current
~2,000
km² net gain
this paper (2010–2023)
Next
~3,000
km² net gain
exceed 1984 baseline
~10-15 years at current rates, if regional losses stabilize
Verified Facts (8)
Losses of nearly 3,000 square kilometers between 1984 and 2010
Increase of nearly 2,000 square kilometers of mangroves after 2010
About two-thirds of the expansion was due to mangroves colonizing new areas and the other third due to restoration and regrowth
Burma lost 28.6 percent of its mangrove area between the 1980s and 2010; since then, the country's mangrove area has grown about 10 percent
Mangrove trees average about 13 meters (43 feet) tall
Mangrove ecosystems storing up to four times as much carbon as taller inland tropical forests
Zhang, Z., et al. (2026) Unexpected expansion and regrowth in Earth's mangrove forests over the past four decades. Science, 392(6802), 1082-1087
Landsat imagery collected between 1984 and 2023
Practical Implications (4)
Coastal planners can use the inflection-point evidence to justify mangrove protection budgets with empirical, not just modeled, support
Carbon-credit verification programs now have a 39-year baseline against which to measure mangrove restoration claims
The geographic unevenness (Niger Delta losses, cyclone vulnerabilities) identifies where intervention is most urgent
The finding that two-thirds of gain is natural colonization, not restoration, suggests policy should focus on protecting sediment delivery and reducing coastal development pressure rather than only planting trees
More latest news
Read all