MORNING TEMPS
30s°F
SATELLITES USED
2
DATE · 2026
Nov 8
STATES AFFECTED
4
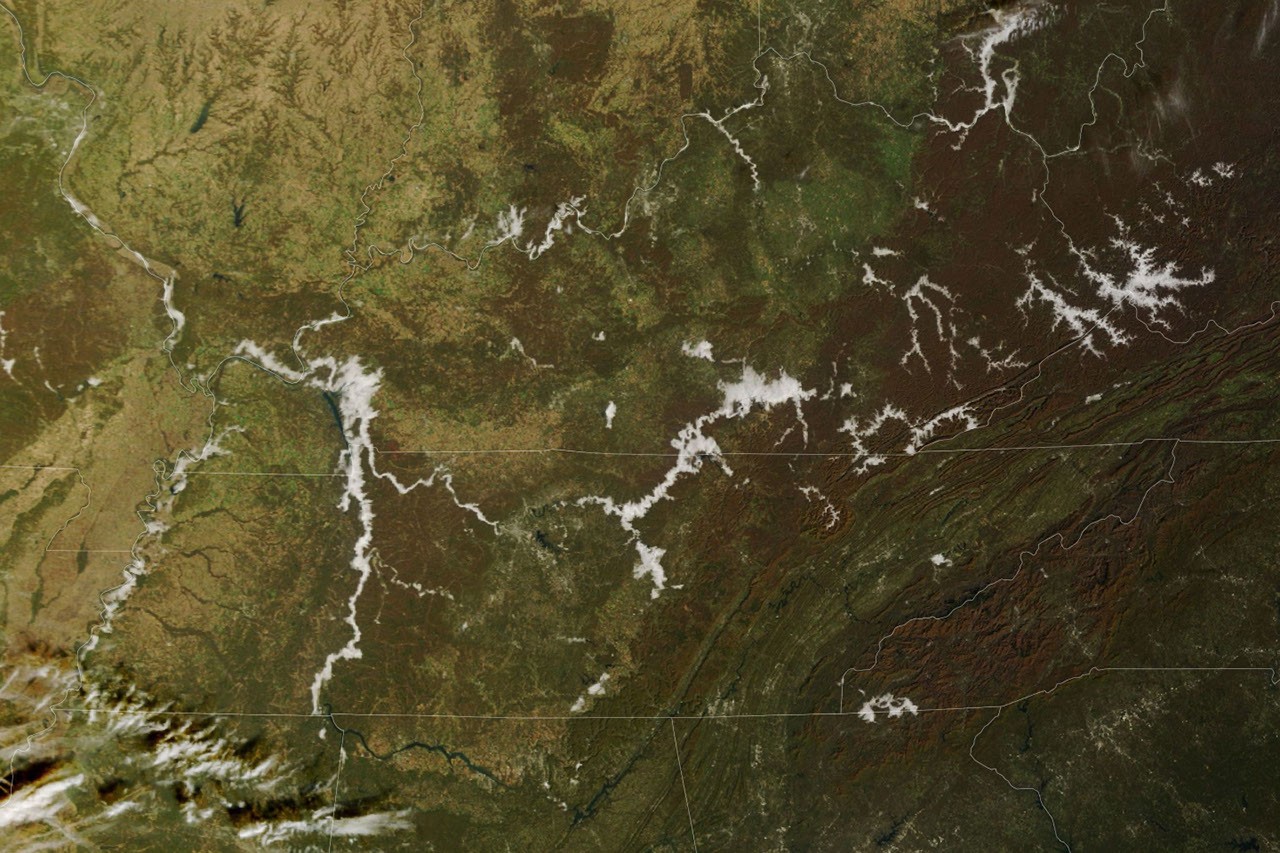
On November 8, 2026, two NASA and NOAA satellites captured a clean before-and-after of one of the most common and least-understood atmospheric events in the eastern United States: valley fog across the Appalachian Plateau. The morning image from NASA's Terra satellite (MODIS instrument) shows dense white fog filling branching river valleys across eastern Kentucky, southwestern West Virginia, and the Cumberland River corridor in Tennessee and Kentucky. By afternoon, NOAA-21's VIIRS instrument shows the same terrain fog-free, rivers and lakes visible in dark blue against bright green vegetation.
Extraction Map
The mechanism is straightforward physics, elegantly illustrated at scale. As autumn nights lengthen, the ground radiates away daytime heat for more hours. Air just above the surface cools to its dew point — the temperature at which water vapor saturates and condenses into the tiny droplets that constitute fog. Cold air, being denser, flows downhill and pools in valleys. Fog forms there first and thickest. Rivers and streams running along valley floors amplify the effect by supplying extra moisture. The images show this pattern clearly: fog traces the branching drainage network of the Appalachian Plateau and follows the Cumberland River and its reservoirs. The geographic fingerprint of fog matches the hydrological map almost perfectly. The National Weather Service recorded temperatures dipping into the 30s Fahrenheit across the region that morning before a mild, sunny afternoon took over. Forecasters flagged locally dense valley fog on November 8 and noted that earlier in the week, a broader fog event had prompted hazardous-travel advisories across the region. The image pair also demonstrates the complementary value of two different sensor types. MODIS on Terra provided the natural-color morning view — intuitive, showing fog as white against brown and green autumn terrain. VIIRS on NOAA-21 provided the afternoon false-color view, which makes water bodies pop in dark blue against vegetation, confirming what the fog had been hiding. This is a public-knowledge contribution, not a policy or extraction story. NASA Earth Observatory's Image of the Day series makes satellite data accessible and visually legible, converting raw instrument passes into paired images that teach atmospheric science to anyone willing to look. The images were processed by Lauren Dauphin using MODIS data from NASA EOSDIS LANCE and GIBS/Worldview, and VIIRS data from NASA EOSDIS LANCE, GIBS/Worldview, and the Joint Polar Satellite System. The story was written by Kathryn Hansen. The practical value is real but easy to overlook. Dense valley fog kills people on roads. Understanding where it forms — and having satellite confirmation that it tracks drainage networks predictably — feeds into better NWS advisories, better highway-department decisions, and better driver awareness in Appalachian communities that deal with this every autumn.
Worth reading?
RECOMMENDED
Score
72
/100
Generative — freely distributed satellite imagery and atmospheric science education that builds public understanding and supports weather forecasting infrastructure at zero cost to the public.
What Is GRIN?
GRIN stands for Generativity, Resilience, Innovation efficiency, and Novelty openness. These four dimensions capture the essential characteristics of any memetic intelligence — whether a nation, a corporation, a religion, or a movement.
About GRINGenerativity
4/5
Resilience
3/5
Efficiency
4/5
Novelty
2/5
Extractive
0/5
Inverted
Does this create new capability or just redistribute existing value?
Pure knowledge generation. Open-access satellite data paired with clear science communication creates capability for forecasters, educators, and the public. No value captured or gated.
Verified Facts (6)
On November 8, 2026, low clouds traced the branching valleys of the Appalachian Plateau and the Cumberland River in the morning then burned off by afternoon.
The MODIS (Moderate Resolution Imaging Spectroradiometer) on NASA's Terra satellite acquired the left image that morning.
The VIIRS (Visible Infrared Imaging Radiometer Suite) on NOAA-21 acquired the right image that afternoon.
Temperatures in many places on the morning of November 8 dipped into the 30s Fahrenheit before giving way to a mild, sunny afternoon.
Dense fog had also blanketed a wider part of the region earlier in the week, prompting advisories for hazardous travel conditions.
NASA Earth Observatory images by Lauren Dauphin, using MODIS data from NASA EOSDIS LANCE and GIBS/Worldview, and VIIRS data from NASA EOSDIS LANCE, GIBS/Worldview and the Joint Polar Satellite System (JPSS). Story by Kathryn Hansen.
More latest news
Read all